
The two trains and bird problem is a classic math puzzle, not a bird mortality scenario. Two trains start some distance apart and travel toward each other; a bird flies back and forth between them at constant speed until the trains collide. The question asks how far the bird travels in total. The clean answer: multiply the bird's speed by the time it takes the trains to meet. That's it. The puzzle is a beautifully deceptive teaching tool for infinite geometric series and mental shortcuts, but it tells us almost nothing useful about how real birds behave near rail lines, which is a separate and genuinely important question. For related concerns about when birds are considered nuisance species and how that affects management, see our guide Is bird a pest.
Two Trains and Bird Problem: Puzzle, Reality, and Safety

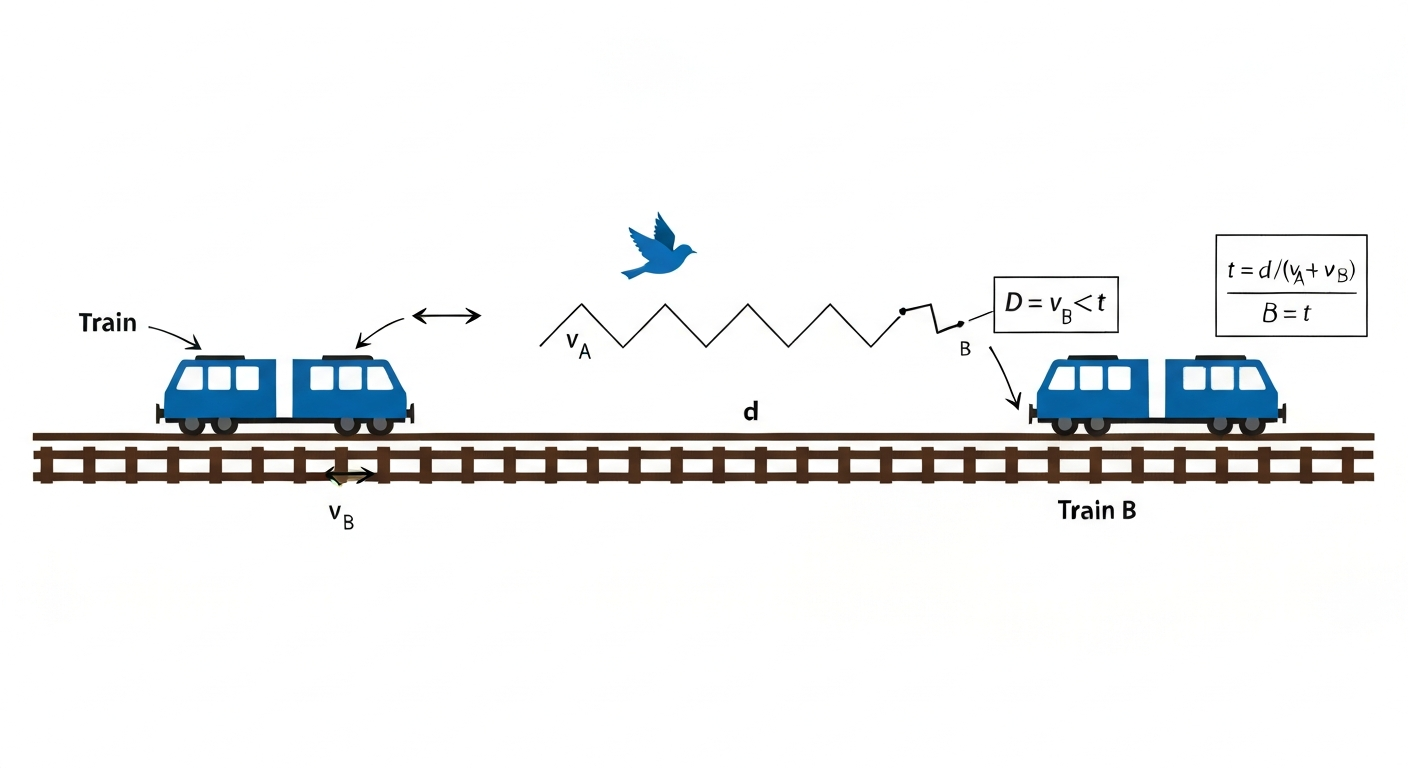
Why this puzzle matters beyond the math classroom
People searching for the two trains and bird problem are mostly looking for a math solution, and that's where we'll spend most of our time. But this site exists to separate mathematical models from biological reality, and the puzzle contains assumptions that are worth examining carefully. When I look at the problem through a bird-safety lens, the contrast is striking: the puzzle bird flies at speeds that real birds rarely sustain, turns instantaneously with no energy cost, and never tires. Real birds around railways behave very differently. Understanding both the math and its biological limits is genuinely useful, whether you're a teacher, a researcher studying bird collisions, or a rail operator trying to reduce mortality on a high-speed line.
The classic puzzle, stated precisely
Here is the canonical formulation as it appears in recreational mathematics and educational sources, including the Wolfram MathWorld entry. Some sources and informal discussions also refer to this puzzle as the 'black bird problem'. Two trains, Train A and Train B, start at opposite ends of a straight track separated by a distance d. They travel toward each other at constant speeds vA and vB respectively. At the moment the trains begin moving, a bird (or fly, or bee, depending on the version) starts at the front of Train A and flies toward Train B at a constant speed vb, where vb is greater than both train speeds. When the bird reaches Train B, it instantly reverses direction and flies back toward Train A, then reverses again, and so on. The bird continues this back-and-forth flight until the two trains collide at the same point. The question: what is the total distance the bird travels?
A note on terminology: the problem appears with different animals in different traditions (a fly in many American textbook versions, a bee in some European ones, a bird in others). The math is identical regardless of species. For this article, we'll use 'bird' throughout, consistent with the search term and this site's focus.
Variables defined
| Symbol | Meaning | Units (typical) |
|---|---|---|
| d | Initial distance between the two trains | miles or km |
| v_A | Speed of Train A (moving right, toward B) | mph or km/h |
| v_B | Speed of Train B (moving left, toward A) | mph or km/h |
| v_b | Bird's constant flight speed | mph or km/h |
| t | Time until the trains collide | hours |
| D | Total distance the bird travels | miles or km |
| n | Leg number (1st trip, 2nd trip, etc.) | dimensionless |
Assumptions you must fix before solving
The puzzle only has a clean closed-form answer under a specific set of assumptions. Changing any one of them changes the method you need. Being explicit about these is not pedantry; it's the difference between getting a right answer and a wrong one, and it also reveals exactly where the model breaks down biologically.
- Constant train speeds: both trains travel at fixed, unchanging speeds from start to collision. No acceleration, no deceleration, no stopping.
- Constant bird speed: the bird maintains exactly v_b throughout every leg of its journey, in both directions.
- Instantaneous reversals: the bird turns around the instant it reaches a train. There is no turning time, no deceleration, and no energy cost for changing direction.
- Point-like bird: the bird occupies no space and has no physical size. It cannot be struck by a train mid-flight.
- Infinite endurance: the bird never tires, never slows, and can fly indefinitely without rest or energy depletion.
- One-dimensional track: the trains move along a single straight line and so does the bird. There is no lateral movement.
- Bird speed exceeds closing speed: vb must be greater than (vA + v_B), otherwise the bird could never reach the oncoming train before the trains meet.
- Trains collide at a single point: the puzzle ends precisely when the trains meet; the bird's fate at that moment is not addressed.
Solution A: the step-by-step infinite series derivation
This approach breaks the bird's journey into individual legs and sums them as a geometric series. See The Art of Insight (MIT OCW), Problems: Two trains and a fly (infinite-series derivation) for a worked infinite geometric‑series derivation that breaks the fly's zig‑zag into successive legs and sums them to infinity The Art of Insight (MIT OCW) — Problems: Two trains and a fly (infinite-series derivation). It's longer but reveals the underlying structure and is the method used in MIT OpenCourseWare problem sets and calculus textbooks like OpenStax Calculus Volume 2.
- Leg 1 (bird flies from Train A toward Train B): The bird and Train B are approaching each other. The bird moves at vb to the right; Train B moves at vB to the left. Their closing speed is (vb + vB). The initial gap at the start of Leg 1 is d. Time for Leg 1: t1 = d / (vb + vB). In that time, Train A has moved vA × t1 to the right and Train B has moved vB × t1 to the left. Distance covered by bird on Leg 1: d1 = vb × t1 = vb × d / (vb + v_B).
- Gap at the start of Leg 2: After Leg 1, the new gap between the trains equals the original gap minus how far both trains traveled: d2 = d − (vA + vB) × t1 = d × [1 − (vA + vB)/(vb + vB)] = d × (vb − vA) / (vb + vB).
- Leg 2 (bird flies from Train B back toward Train A): Now the bird moves left at vb and Train A moves right at vA. Closing speed is (vb + vA). Time: t2 = d2 / (vb + vA). Bird distance on Leg 2: d2bird = vb × d2 / (vb + vA) = vb × d × (vb − vA) / [(vb + vB)(vb + v_A)].
- Pattern and ratio: each pair of legs shrinks the gap by a constant ratio r = (vb − vA)(vb − vB) / [(vb + vA)(vb + vB)]. Since v_b > both train speeds, 0 < r < 1, so the series converges.
- Total distance: D = d1 + d2bird + d3bird + … This is a geometric series with first term a = vb × d / (vb + vB) and common ratio r = (vb − vA)(vb − vB) / [(vb + vA)(vb + vB)]. Sum = a / (1 − r). After algebraic simplification (substituting and factoring), this reduces to D = vb × d / (vA + v_B).
The infinite-series algebra is genuinely messy, but it collapses to the same clean formula as the quick trick. That collapse is the pedagogical payoff: it confirms that the shortcut is not a cheat but is mathematically exact. Pedagogical literature discusses this payoff and potential student confusion (see A famous problem revisited, International Journal of Mathematical Education in Science and Technology) A famous problem revisited — International Journal of Mathematical Education in Science and Technology. The series approach also illuminates why Zeno-style worries about infinite trips are unfounded: the total time and total distance both converge to finite values because the individual legs shrink geometrically.
Solution B: the quick trick, explained properly
This is the approach attributed in mathematical folklore to John von Neumann, though the story is almost certainly apocryphal. The anecdote, recounted in multiple biographies, claims von Neumann solved it instantly and, when told he had used the fast method, replied that he had actually summed the series. Whether or not that exchange happened, the insight behind the trick is legitimate and worth understanding on its own terms.
The key observation: you do not need to know how many trips the bird makes, or how long each trip is. You only need to know how long the bird is flying in total. Since the trains close at a combined speed of (vA + vB) and start at distance d apart, the time until collision is fixed: t = d / (vA + vB). The bird flies the entire time at constant speed vb. Therefore the bird's total distance is simply D = vb × t = vb × d / (vA + v_B).
The justification is that total flight time is determined entirely by the trains, not by the bird's path. The bird's zig-zag is irrelevant to the time calculation. This works only because all speeds are constant and the bird never stops. If any of those conditions fail, the trick breaks down and you need the series or a numerical simulation.
Worked numeric examples
Example 1: the textbook standard
This is the version that appears most frequently on puzzle sites like MathIsFun and in classroom worksheets. Train A travels at 60 mph, Train B at 40 mph, and the bird flies at 100 mph. The trains start 100 miles apart. Time to collision: t = 100 / (60 + 40) = 100 / 100 = 1 hour. Total bird distance: D = 100 × 1 = 100 miles. Notice that the bird flies at exactly the closing speed of the trains, making the arithmetic especially clean, which is why this version appears so often in teaching materials.
Example 2: unequal speeds
Train A travels at 30 mph, Train B at 50 mph, and a bird flies at 120 mph. The trains start 120 miles apart. Time to collision: t = 120 / (30 + 50) = 120 / 80 = 1.5 hours. Total bird distance: D = 120 × 1.5 = 180 miles. The bird travels 60 miles more than the initial gap between the trains, which surprises many students who expect the answer to be close to 120 miles.
Example 3: metric units, closer to realistic speeds
This example scales the numbers down toward biologically plausible territory. Train A at 80 km/h, Train B at 80 km/h (head-on collision scenario), and a bird flying at 40 km/h. Wait: at 40 km/h the bird is slower than the combined closing speed of 160 km/h, but the bird only needs to outrun a single train, not both. As long as v_b (40 km/h) exceeds neither train's individual speed (both at 80 km/h), the bird cannot complete even a single leg. So this combination is impossible under the standard assumptions. This matters biologically: a European starling cruising at approximately 40 km/h (around 11 m/s, as measured in experimental flight studies) cannot complete the puzzle task against trains moving at 80 km/h or more. The bird's speed must exceed at least one train's speed to reach it before the trains collide. If we instead set train speeds at 20 km/h each, the bird at 40 km/h can complete legs. Time to collision: t = 10 / (20 + 20) = 0.25 hours. Bird distance: D = 40 × 0.25 = 10 km.
Example 4: racing pigeon speeds
Homing and racing pigeons achieve average long-distance speeds of roughly 50 to 70 km/h, with elite short-burst speeds reported above 100 km/h. Take a pigeon at 75 km/h, Train A at 30 km/h, Train B at 30 km/h, starting 60 km apart. Time to collision: t = 60 / (30 + 30) = 1 hour. Bird distance: D = 75 × 1 = 75 km. Now the puzzle works and the numbers are biologically grounded, though the assumption of constant speed and infinite endurance still doesn't hold for a real bird.
| Example | Train A speed | Train B speed | Bird speed | Starting distance | Collision time | Bird distance |
|---|---|---|---|---|---|---|
| 1 (classic) | 60 mph | 40 mph | 100 mph | 100 miles | 1.0 hr | 100 miles |
| 2 (unequal trains) | 30 mph | 50 mph | 120 mph | 120 miles | 1.5 hr | 180 miles |
| 3 (metric, slow trains) | 20 km/h | 20 km/h | 40 km/h | 10 km | 0.25 hr | 10 km |
| 4 (pigeon speed) | 30 km/h | 30 km/h | 75 km/h | 60 km | 1.0 hr | 75 km |
Puzzle variants and how each change breaks the standard solution
The quick trick works precisely because every assumption holds simultaneously. Alter any assumption and you need a different approach. Research documented in arXiv preprints and on Math StackExchange threads covers several of the common variants in detail.
Finite bird stamina (the bird stops after n legs)
If the bird can only complete a fixed number of legs before stopping, you must sum only the first n terms of the geometric series rather than the full infinite sum. The formula becomes a partial geometric sum: D_n = a × (1 − r^n) / (1 − r), where a is the first leg length and r is the ratio defined earlier. This is a much closer approximation to real bird biology, where fatigue and energy depletion are genuine constraints.
Accelerating trains
If either train accelerates, the closing speed changes over time and the collision time is no longer a simple division. You need kinematics (for constant acceleration: d = (vA + vB) × t + ½(aA + aB) × t², solve for t) and then numerical integration or simulation to compute the bird's individual legs, since each leg's duration now depends on positions that change non-linearly. The quick trick fails completely here.
Bird collides with a train mid-flight
In the standard puzzle the bird is point-like and collisions with trains don't happen mid-flight. If you give the bird a finite size, it can be struck by a train before reaching the other end. This variant requires specifying the bird's wingspan and treating each crossing as a geometry problem. It introduces a small probability of early termination on each leg. This is actually the most biologically realistic variant.
Trains moving in the same direction
If both trains move in the same direction, they only meet if Train A (behind) is faster than Train B (ahead). The closing speed is now (vA − vB), not the sum. If the bird starts on the slower train, the problem can still converge but takes longer. If vA < vB the trains never meet and the problem has no finite solution. The quick trick still works as long as the trains do eventually meet: t = d / (vA − vB) and D = v_b × t.
Multiple birds
Adding a second or third bird flying simultaneously does not change the total distance for each individual bird, since each bird's travel time is still determined by the trains. However, if the birds interact (avoid each other, flock, draft off one another), the constant-speed assumption breaks down and the problem requires simulation. Interestingly, there is experimental evidence from starling and pigeon studies showing that trailing birds in small groups expend less metabolic energy, which means group flight changes individual speed profiles in ways the puzzle ignores entirely.
What the puzzle's assumptions mean in real life
Working through this puzzle carefully exposes just how far removed the mathematical model is from physical reality. The assumptions of constant speed, instantaneous turning, and infinite endurance are standard mathematical conveniences, but they have measurable biological costs when applied to actual birds.
Modern high-speed rail lines in Europe and East Asia operate at 200 to 350 km/h. Even the fastest bird species in level flight cannot approach those speeds. A peregrine falcon in a dive can exceed 300 km/h, but that is a ballistic descent, not the sustained level-flight crossing required by the puzzle. In level flight, most passerines cruise at 30 to 60 km/h. Turning around instantaneously at high speed requires enormous aerodynamic forces that would injure or kill a bird. Real birds slow down before reversals, bank through arcs, and use energy at rates that scale steeply with speed. The puzzle bird's infinite endurance is, in biological terms, the most absurd assumption of all.
Do birds actually behave like the puzzle bird near railways?
The reality is: not even slightly. Research on flight initiation distance (FID), which measures how close a vehicle can approach before a bird takes flight, shows that birds respond to approaching trains with species-specific and context-specific escape behavior. A meta-analysis published in a peer-reviewed journal found that European birds adjust their FID to road speed limits, with higher-speed vehicles prompting earlier escape responses. The same principle applies to rail vehicles, though rail-specific data are more limited. Birds do not fly back and forth between approaching trains; they detect the threat and attempt to flee to the side, perpendicular to the track.
Flock size matters too. Individual birds in open habitat tend to have longer FIDs than birds in flocks, partly because flocks may rely on collective vigilance, and partly because the predation-risk calculation changes in groups. A bird foraging alone beside a track will typically depart earlier than one in a group, but both will flee laterally rather than flying along the track toward oncoming trains. The puzzle's one-dimensional model is incompatible with how birds perceive and respond to threats in three-dimensional space.
How often are birds harmed by trains? What the data actually show
This is where the research gets genuinely interesting, and where I want to be careful not to overstate or understate what we know. Published data come from a few key study designs: on-board video monitoring of high-speed train fronts, carcass surveys along track corridors, and ecological monitoring of bird populations near rail infrastructure. Each method has well-documented limitations.
A notable 2017 study published in Frontiers in Ecology and Evolution used on-board video cameras on high-speed trains to document actual bird collisions and near-misses. This approach captures events that carcass surveys miss entirely, since high-speed collisions often scatter remains far from the track or render them unidentifiable. The study identified specific species and locations with elevated collision risk. A separate analysis in Scientific Reports, focusing on high-speed railways, found that infrastructure type matters significantly: viaducts and elevated sections show different collision profiles from at-grade track, and surrounding land use (agricultural fields vs. scrubland vs. wetlands) strongly influences which species are at risk.
The honest caveat is that quantifying total bird mortality from rail collisions at a national or continental scale remains difficult. Unlike window collisions, which have been studied extensively and estimated in the hundreds of millions annually in North America alone, rail collision mortality estimates carry large uncertainty bands. Reporting is inconsistent, carcass detection probability is low, and attribution (which species, which segment of track, which time of year) requires sustained monitoring rather than ad hoc surveys.
A note on Plague Inc. and other games that feature birds
Some people arrive at the 'two trains and bird problem' search via game-related queries, particularly around disease-transmission games like Plague Inc., where birds appear as transmission vectors. It is worth addressing this directly because game mechanics and biological reality diverge sharply. In Plague Inc., selecting a bird as a transmission route represents the game designer's abstraction of avian disease spread, not a simulation of actual avian epidemiology. Birds in that game do not follow physics constraints, do not have species-specific flight envelopes, and do not interact with infrastructure in any realistic way. The game is designed for entertainment, not education about bird biology or disease ecology.
Similarly, the puzzle bird is a mathematical abstraction, not a model organism. Both the game bird and the puzzle bird are useful within their own frameworks; the problem arises when people use either one to reason about real bird behavior, disease transmission routes, or collision risk. This site's broader content on topics like invasive bird meaning and the definition of bird pests addresses the genuine ecological questions that games and puzzles can mislead people about.
How this connects to broader bird-risk topics
The puzzle gives us a useful entry point into several bird-risk questions that this site covers in more depth. The species choice matters a great deal: a starling flying at roughly 40 km/h behaves very differently near a railway than a racing pigeon capable of 75 km/h or more. Species that are classified as nuisance birds tend to be habitat generalists that congregate near human infrastructure, including rail corridors, which increases their exposure to collision risk. Starlings, for example, commonly forage along track corridors and on rail sidings.
The question of whether birds constitute pests is relevant here because pest-designated species often receive less regulatory protection, which affects what mitigation tools are legally available to rail operators. Invasive bird species present a specific version of this problem: species introduced outside their native range may lack the learned avoidance behaviors that native species develop near rail infrastructure over generations. Understanding which birds are genuinely invasive (in the ecological sense, not just the colloquial one) matters for deciding where to direct monitoring resources.
Practical guidance for homeowners and pet owners
If you're a homeowner or pet owner reading this because you're worried about birds near your property rather than near rail lines, the puzzle itself isn't your concern. Your practical priorities are different.
- Reduce attractants near roads and driveways: bird feeders placed close to fast-moving traffic increase the probability of vehicle collisions. The recommended guideline is to position feeders either within 1 meter of a window (so birds lack the flight speed to be injured if they strike glass) or more than 10 meters away from any high-speed traffic corridor.
- Supervise outdoor pets near birds: cats are a leading cause of bird mortality in many countries, so keeping cats indoors or in enclosed outdoor runs protects both the birds and reduces the risk of disease transmission in the other direction.
- Avoid habitat features that funnel birds toward traffic: hedgerows running parallel to busy roads can guide birds along corridors that end at vehicle conflict zones. Breaking up linear habitat features with perpendicular gaps reduces this channeling effect.
- Know your local species: some bird species commonly described as nuisance birds or examples of bird pests are actually protected under law. Removing nests, eggs, or adults without permits can carry legal penalties regardless of perceived nuisance status.
Operational guidance for transport operators and rail managers
Rail operators have a more complex set of tools and a more direct role in reducing bird collision mortality. The evidence base here is growing but still incomplete, so I'd emphasize starting with monitoring before investing in expensive engineering interventions.
- Install on-board camera systems on high-speed train fronts for at least one monitoring season before designing mitigations. The 2017 Frontiers study showed that cameras capture collision events and near-misses invisible to carcass surveys, and the data allow species- and location-specific targeting.
- Map high-risk infrastructure types: viaducts, elevated sections, and track segments bordered by wetlands or agricultural fields have documented higher collision rates. Site-specific risk maps allow proportional resource allocation.
- Habitat management within the right-of-way: reducing attractive foraging habitat (short grass, insect-rich verges) directly adjacent to high-speed sections can shift bird activity away from the track corridor. However, removing all vegetation has its own ecological costs and is not universally recommended.
- Acoustic and visual deterrents have mixed evidence; some studies show short-term effectiveness followed by habituation. Rotating or multi-modal deterrents (combining sound, visual flashing, and ultrasonic elements) may extend effectiveness, but require ongoing monitoring to confirm.
- Scheduling considerations: bird activity peaks at dawn and dusk, especially during migration seasons. Where operationally feasible, reducing train frequency during these windows at high-risk sites is a low-cost mitigation.
- Engage with national wildlife agencies and participate in standardized reporting schemes. Consistent data submission improves the evidence base for all operators and supports regulatory guidance development.
Bird strike risk management for aviation professionals
Aviation professionals already operate within well-developed bird strike risk frameworks (FAA Wildlife Strike Database in the US, ICAO guidance internationally, and national equivalents elsewhere), so I'll focus on the areas where evidence is evolving or where confusion with other risk contexts arises.
- Speed thresholds matter in aviation as they do in the puzzle: at higher aircraft speeds, a bird's ability to evade is irrelevant; the physics of impact energy (which scales with the square of closing speed) dominates the outcome. This is why larger, denser birds at slow airspeeds can be more damaging than small birds at high speeds, depending on impact location.
- Habitat modification around airports is the highest-evidence intervention available. Reducing standing water, managing grass height to deter large flocking species, and eliminating food sources (grain spills, refuse) have documented effectiveness in reducing bird activity on airside areas.
- Species identification capability is operationally important: the risk profile of a large gull versus a small passerine differs substantially. Investing in staff training and automated identification systems (acoustic monitoring, radar) is increasingly cost-effective.
- Reporting every strike, even minor ones with no apparent damage, is critical for population-level risk assessment. Database quality depends on near-universal reporting; under-reporting biases risk models toward underestimating hazard frequency.
- Seasonal migration monitoring: radar-based migration monitoring tools (such as BirdCast in North America) provide real-time estimates of nocturnal migration intensity that can be integrated into operational planning for high-traffic airports during peak migration periods.
Guidance for researchers monitoring bird-train interactions
If you're designing a study or participating in citizen science data collection on bird mortality near railways, a few methodological points are worth highlighting because they are frequently underappreciated.
- Carcass surveys require detection-probability correction: carcass persistence is highly variable by habitat, season, and scavenger activity. Without systematic removal trials or occupancy modeling, raw carcass counts are not reliable mortality estimates.
- Matched control transects are essential: comparing bird activity and mortality on rail-adjacent habitat to equivalent habitat away from the track allows you to attribute effects to the rail infrastructure rather than to habitat type.
- Species-level data collection is more valuable than aggregate counts: the ecological and conservation significance of a collision varies enormously between a common invertivore and a species of conservation concern. Standardized photographic documentation and, where appropriate, genetic sampling from carcasses improves data utility.
- Ethical considerations for researchers: disturbing nesting birds during survey work, even inadvertently, can cause secondary mortality. Rail corridor surveys should be timed to avoid breeding seasons for locally sensitive species, and all access to track infrastructure requires safety coordination with the operating company.
- Citizen science programs can cover geographic scales that professional surveys cannot, but data quality controls are non-negotiable. Using standardized protocols (fixed search widths, timed searches, paired observer reliability checks) and submitting to established databases (eBird, iNaturalist with appropriate tagging) maximizes the scientific value of volunteer effort.
Diagrams and figures that would help readers most
Based on how I've seen students and general readers struggle with this puzzle, several specific visuals would add significant value to any article or teaching resource covering this topic.
- Flight-path schematic (top view): a horizontal track with Train A and Train B approaching from opposite ends, and the bird's zig-zag path drawn above the track, with each leg labeled (Leg 1, Leg 2, Leg 3…) and lengths decreasing visually. GeoGebra applets allow interactive versions of exactly this diagram.
- Distance-time graph: a standard x-t plot with three lines: Train A (rising from left), Train B (falling from right), and the bird (a rapidly oscillating line between them). The vertical axis shows position along the track; the horizontal axis shows time. The point where all three lines converge is the collision. This separates the complexity of the bird's path from the simple linearity of the time calculation.
- Step-by-step solution diagram: a table or flowchart showing Leg 1 through Leg 4 with shrinking lengths, the geometric ratio r labeled, and the final arrow pointing to the infinite sum equaling the quick-trick result.
- Variant comparator table: side-by-side columns showing the standard puzzle versus the finite-endurance variant, the accelerating-trains variant, and the same-direction variant, with one-sentence descriptions of how the solution method changes for each.
- Biological speed reference chart: a bar chart comparing the bird speed values used in typical puzzle examples (100 to 200 mph) against published cruising speeds for common species (starlings at approximately 40 km/h, pigeons at 50 to 70 km/h, swifts at approximately 110 km/h in level flight). This visualization immediately illustrates the biological implausibility of most puzzle scenarios.
- Rail collision risk summary table: rows for different infrastructure types (at-grade, elevated, tunnel approach), columns for relative collision frequency, affected species groups, and recommended monitoring method.
Types of references and further reading worth seeking out
For readers who want to dig deeper, here are the categories of sources I'd recommend, organized by the aspect of this topic you're most interested in.
| Topic area | Recommended source types |
|---|---|
| The puzzle itself | Wolfram MathWorld entry; MIT OCW problem notes on infinite series; OpenStax Calculus Vol. 2 infinite series chapter; NRICH task and teacher notes; MathIsFun worked examples |
| Puzzle variants and extended analysis | arXiv preprints on accelerated variants; Math StackExchange discussions on finite-leg versions |
| Bird flight physiology and speed | Peer-reviewed experimental studies on starling flight energetics (PMC-indexed); homing pigeon GPS tracking studies measuring real-world speed distributions |
| Bird escape behavior near vehicles | Meta-analyses on flight initiation distance published in ecology journals; vehicle-speed studies in European bird populations |
| Bird-train collision data | Frontiers in Ecology and Evolution on-board video study (2017); Scientific Reports high-speed rail mortality analyses; national wildlife monitoring agency reports |
| Aviation bird strike management | FAA Wildlife Strike Database; ICAO Airport Services Manual Part 3; BirdCast real-time migration radar resources |
| Research methodology | Nature author formatting guide for tables and figures; standardized carcass survey protocols from national ornithological societies |
What this all actually means: measured takeaways
The two trains and bird problem is one of the most elegant teaching puzzles in recreational mathematics. Its core lesson is not about birds at all: it is about recognizing when a complicated-looking problem (infinite zig-zags) can be reframed around a simpler invariant (total time is fixed by the trains). That insight, the habit of looking for the governing constraint rather than grinding through the details, is genuinely useful in many fields.
What the puzzle does not teach, and was never intended to teach, is anything about real bird biology, bird collision risk, or bird behavior near infrastructure. The puzzle bird is immortal, infinitely energetic, point-sized, and flying at speeds that real birds cannot sustain. Extrapolating from it to biological claims about bird mortality or bird behavior near trains is the kind of category error this site exists to address.
The practical actions differ clearly by audience. If you're a math student or teacher, both solution methods are worth knowing: the series derivation shows why it works, and the quick trick shows how to work efficiently. If you're a rail operator, invest in on-board camera monitoring before assuming you know your collision risk profile. If you're an aviation professional, lean on the existing regulatory frameworks while incorporating newer tools like radar-based migration monitoring. If you're a researcher, prioritize detection-probability correction in any carcass survey before treating raw counts as mortality estimates. And if you arrived here from a game like Plague Inc. wondering whether the bird mechanic maps onto real biology: it doesn't, and the gap between game abstraction and ecological reality is exactly the kind of thing worth understanding clearly.
FAQ
What is the primary research question needed to write an accurate, evidence‑based article that explains the "two trains and bird" puzzle and separates the math from biological reality?
Identify exactly what the article must deliver: a clear puzzle statement and assumptions; two full solution methods (infinite‑series/stepwise and the time×speed shortcut) with worked numeric examples and common variants; an evidence‑based account of real bird flight behaviours and species flight speeds; empirical data on bird–train collision frequency and risk factors; and practical mitigation guidance for homeowners, pet owners, transport operators and aviation professionals. This defines the scope for literature searching and source selection.
What canonical mathematical sources should be consulted to document the standard puzzle statement and both solution methods?
Authoritative math/pedagogy sources: MathWorld (canonical puzzle statement and short trick), MIT OCW and OpenStax or calculus texts (infinite geometric‑series derivation and worked problems), math education journals (teaching notes and warnings about infinity/Zeno issues), and reputable puzzle/education sites (MathIsFun, NRICH) for classroom examples and numeric choices.
What specific research questions must be answered to present the mathematical formulation and worked numeric examples?
• Exact puzzle statement and assumptions (initial separation d, constant train speeds v1 and v2, fly speed vf, instantaneous turning, continuous flight until collision). • Derive time to collision t = d/(v1+v2). • Show infinite‑series decomposition of successive legs and sum. • Show the shortcut computation distance = vf × t and reconcile with series. • Provide several numerical examples with realistic units and common classroom numbers. • Show variants (finite legs, accelerations, turning time) and how they change the solution method.
What source categories are required to separate the mathematical model’s assumptions from biological reality?
Primary literature and reviews on bird flight biomechanics and ecology (peer‑reviewed journals, PMC/Nature/Frontiers), species flight‑speed studies (starlings, pigeons, raptors), behaviour research on flight‑initiation distance and responses to vehicles, and empirical monitoring studies of railway collisions (on‑board video, carcass surveys, large‑scale analyses). Also include meta‑analyses and regionally relevant monitoring reports to capture variation by species and context.
Which species and flight‑speed references should be included to give realistic biological benchmarks for the puzzle’s bird speed parameter?
Peer‑reviewed studies providing species flight speeds and movement data: e.g., starling cruise speeds (~11 m·s⁻¹ ≈ 40 km·h⁻¹) for small passerines, homing pigeon speed studies reporting typical averages 50–70 km·h⁻¹ and bursts >100 km·h⁻¹, plus any relevant telemetry or field studies for larger birds and raptors. These give order‑of‑magnitude realism to numerical examples.
What empirical evidence and source types are needed to report how often birds are harmed by trains and what factors influence collision risk?
Peer‑reviewed empirical studies and monitoring reports: on‑board video studies, carcass surveys, large‑scale analyses of high‑speed rail collision rates, and infrastructure risk‑assessments. Sources should document species affected, spatial hotspots (viaducts, bridges), train speeds and frequency, habitat contexts, and recommended monitoring/mitigation actions.